~ Lead Developer (BSc Final Project)
Built a web-based platform to help students and educators understand algorithms through interactive visualisations and an integrated IDE. The system allows users to explore, modify, and contribute algorithms, making learning more engaging and practical.
Timeline
~ 10 Months
(August 2022 - May 2023)
Impact
Made algorithm learning more accessible by combining visualisation with hands-on coding. Improved engagement for students and provided educators with a practical tool to teach complex concepts interactively.
The Algorithm Visualiser was developed as part of my Bachelor’s dissertation to
simplify the learning of algorithms through interactive visualization and experimentation.
The platform provides a central interface where users can browse different algorithms,
see their step-by-step execution, and understand their flow with graphical outputs.
Alongside visualization, it features an integrated IDE that lets learners edit and run code,
offering a hands-on way to test changes and immediately see the results.
Designed for both students and educators, the project bridges the gap between
abstract algorithm concepts and practical understanding, making learning more engaging,
accessible, and collaborative.
Objective
The objective of this project was to design a platform that makes algorithms easier
to learn and understand by combining graphical visualization with an
interactive coding environment. It aimed to provide students and educators with a
single tool to explore, edit, and run algorithms, bridging the gap between
theoretical concepts and practical application.
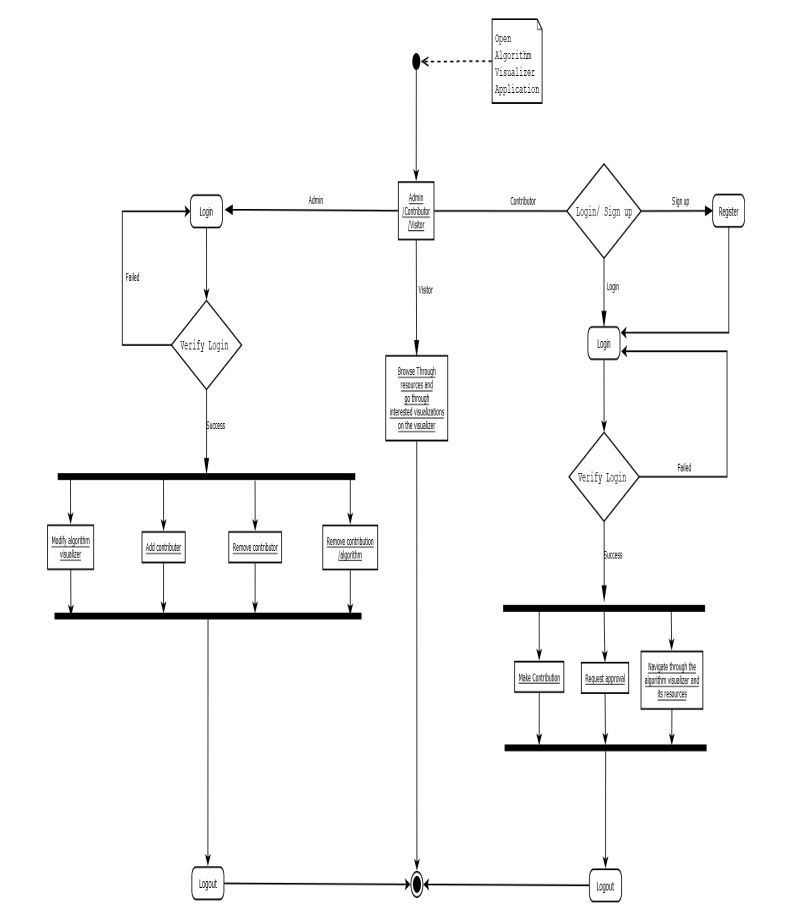
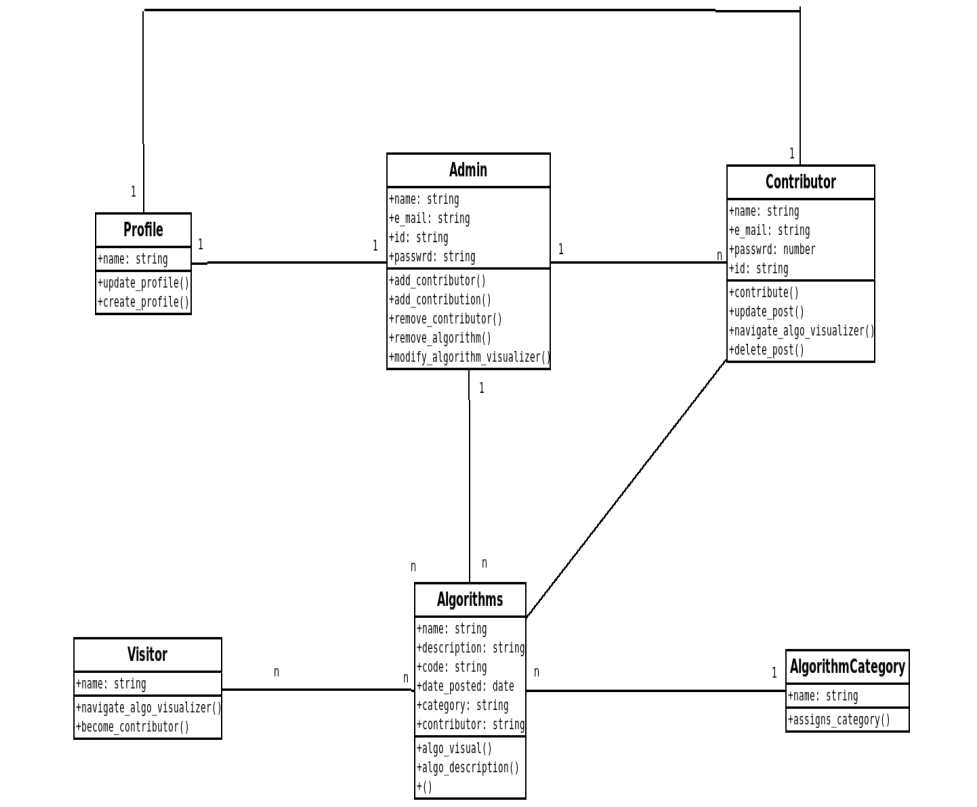
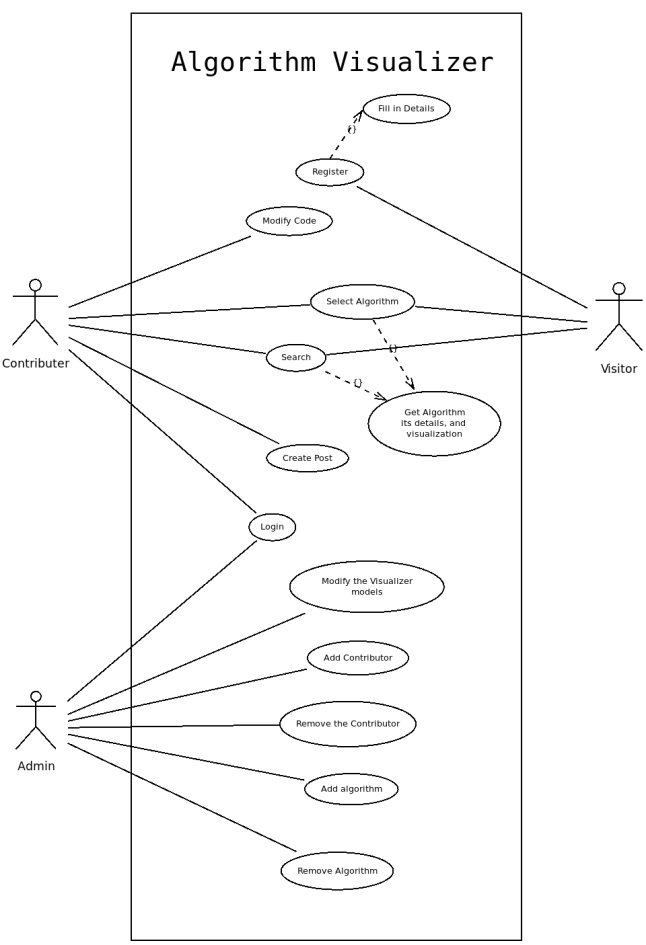
Design and Developments
The Designing of this web app is sub-divided into two parts which consists of:
- The website, that serves the purpose of showcasing the working of the algorithm visualiser and other sections including a contributors dashboard where a user of the platform can be an integral part of the project and its development by contributing to the best of their abilities to the documentation of the algorithms that are part of the visualiser's resources. And,
- The terminal itself, which is the visualiser of all the documented algorithms on the platform and any provided at the moment by the user themselves.
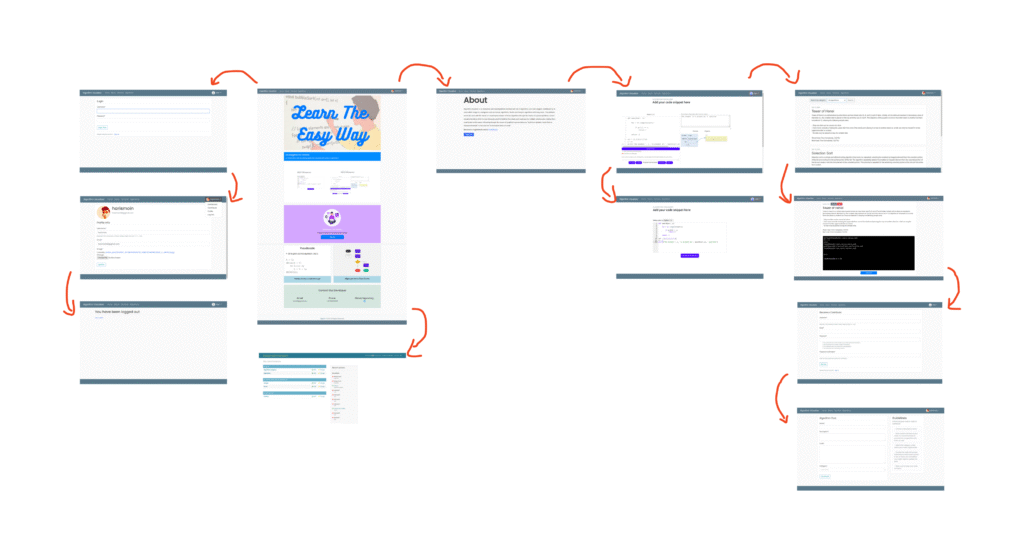
The Website's interface and navigation (shown through site-map based web framework) :
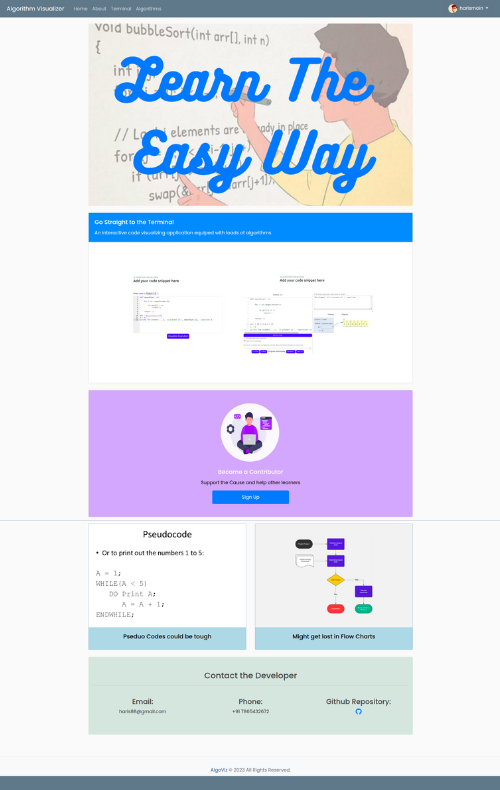
The Home Page :
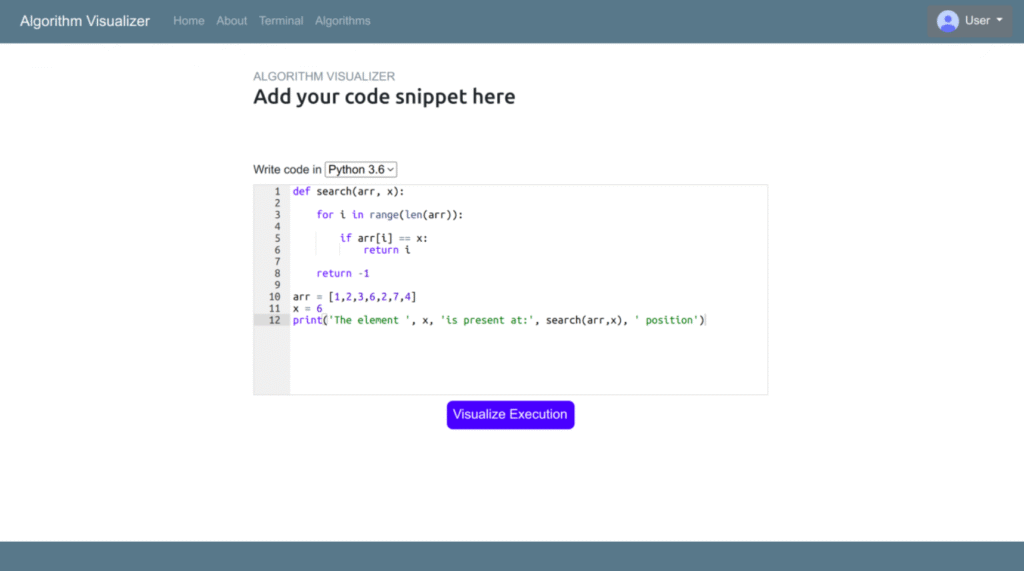
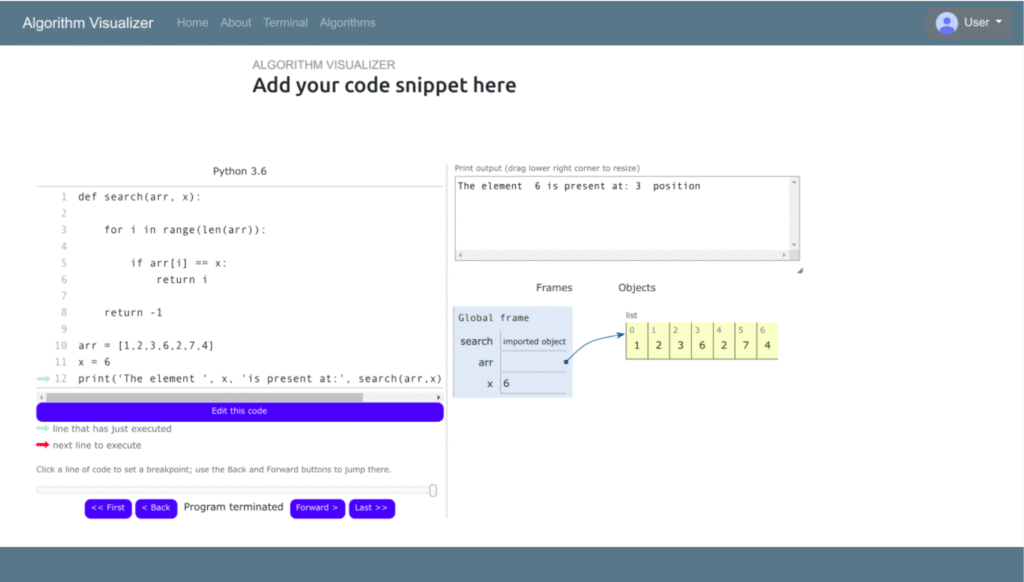
The terminal interface :
* Pictures above show the working of the terminal visualising a simple Linear Search algorithm, given its input on the left and the visual outcome on the right. The user is able to control the flow of algorithm based on how it interprets each line of code given the instance it has at each point through the bar at the very bottom of the interface.
The Algorithm Visualiser is a web-based platform created to enhance the understanding
of algorithms through step-by-step visualization and hands-on coding.
By integrating an IDE with graphical outputs, it allows users to not only view how algorithms work
but also experiment with their code in real time. The project provides an engaging and practical
learning tool for students and educators, turning abstract concepts into interactive experiences.